• English
  • 简体中文
  • 繁體中文
  • Tiếng Việt
  • ไทย
  • Indonesia
Subscribe
Real-time News
According to Fox News: U.S. fiscal spending in September was $585 billion, compared to $346 billion in September 2025; fiscal revenue was $558 billion, compared to $544 billion in September 2025.Sources say the U.S. Federal Aviation Administration is expected to approve the Boeing (BA.N) 737 MAX 10 next week.On October 17th, local time, US President Trump stated on October 16th that the position of White House Press Secretary might not be suitable for Katie Zakaria. He said he would speak with Zakaria. Trump stated that he had told Zakaria she should reconsider the position. According to White House officials, Katie Zakaria is preparing to step down as Trumps press secretary. The position had been vacant since the departure of the previous White House Press Secretary, Levitt, at the end of August. Trump announced the appointment of conservative commentator Zakaria as White House Press Secretary on October 9th. Zakaria was previously a senior communications advisor for Real Social, a website under Trump Media Technology Group, and also served as a spokesperson for the Department of Homeland Security and Deputy Assistant Secretary for Public Affairs. She frequently appears as a commentator for conservative media outlets such as Fox News. However, Zakarias performance at her first White House briefing on October 13th was poor, and accusations of falsifying her resume raised questions about her abilities.Intercontinental Exchange: As of the week ending October 13, net long positions held by diesel speculators increased by 5,304 contracts to 75,461 contracts.Indian Shipping Minister: On October 16, the crude oil tanker MT ST 3, carrying 15 Indian seamen, was hit by a shell in the Strait of Hormuz.

Best Time To Trade When Double Bottoms Coming

Eden

Oct 25, 2021 14:08

内1.png


What is a Double Bottom?

A double bottom pattern is a technical analysis charting pattern that describes a change in trend and a momentum reversal from prior leading price action. It describes the drop of a stock or index, a rebound, another drop to the same or similar level as the original drop, and finally another rebound. The double bottom looks like the letter "W". The twice-touched low is considered a support level.


The double bottom chart pattern is found at the end of a downtrend and resembles the letter "W"(see chart below). 


Price falls to a new low and then rallies slightly higher before returning to the new low. Unable to push price to a new lower low to continue the downtrend, sellers give up and price bounces sharply from this area.The bullish confirmation is specified by a break in the key price level situated at the high point between the ‘bottoms’ resistance level (neckline).


W底英文1.png


Similarly, the double top pattern reciprocates the double bottom pattern signaling a bearish reversal. Instead of the confirmation being shown at a break in the key resistance level, the double top occurs at the key support lows between the two high points. The double bottom and double top patterns are powerful technical tools used by traders in major financial markets including forex.


The double bottom is frequently used in the forex/gold and equity markets as buy/bullish signals. 


For example

1. Gold

The gold price trend in the first half of this year perfectly presented the  double bottom pattern.

W底英文2.png

As shown in the figure, since January 2021, the price of gold has continued to fall.It fell to a new low (point A) near $1,67.75 in March, then rebounded slightly from the low point, and then fell back to a level close to the last low of $1,699.75 (point B).


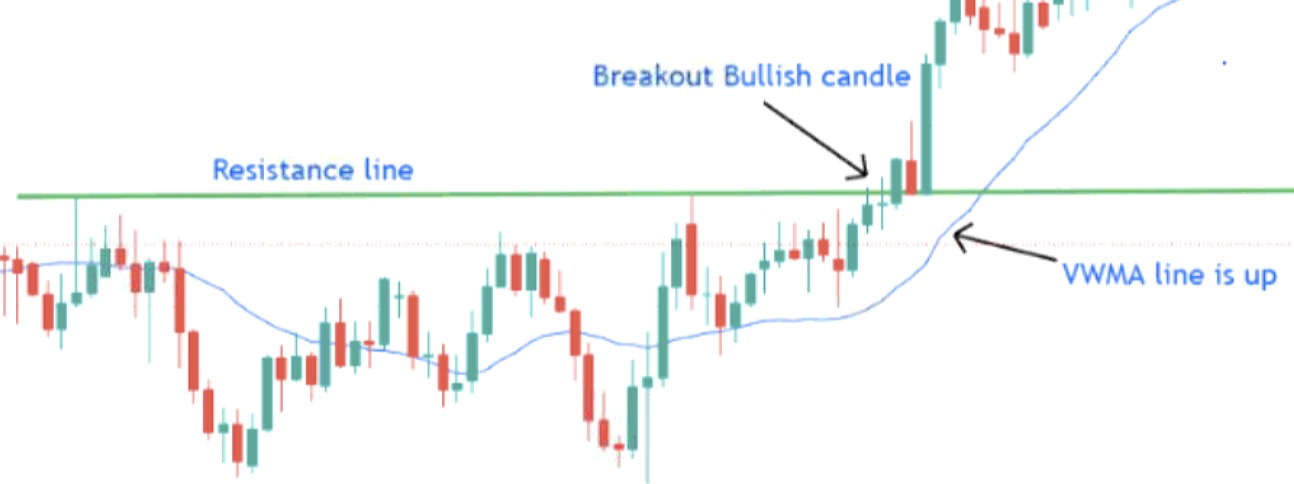
This example shows the neckline break confirmation entry signal whereby the price closes above the neckline which will then indicate a long entry.The highlighted candle in the image above clearly closes above the neckline after some resistance, indicating a stronger push by bulls to push the price up.


As shown in the figure below, after breaking through $1,800 per ounce in April (C point), gold has risen all the way. In June, the price of gold regained $1,900.

图4.png


2. USD/SGD

As shown in the figure below, observing the USD/SGD price trend weekly chart, you can see that the bottom of W has also been formed.

图5.png


Investors can observe the USD/SGD price trend in the market outlook and judge what happens to the price after the end of “W”.


3. Gas


As shown in the figure below, observe the weekly chart of natural gas price trends, and the“ W” will be formed around May 2020.


The first price low was at point A, around $1.58, then the price rebounded to point B, at $2.06, and then again fell back to point C near the last low of $1.58.


After the price successfully broke the neckline (point B) at $2.06, the price of natural gas continue to rise.

图6.png


How to identify a double bottom pattern?

1. Identify the two distinct bottoms of similar width and height.

2. Distance between bottoms should not be too small - time frame dependent.

3. Confirm neckline/resistance price level.

4. Use other technical indicators to support double bottom bullish signal such as moving averages and oscillators.

5. Be wary of trading against strong trends.


It is important to note that trading against a strong downward trend should be approached with caution even with a double bottom formation. Convincing supporting factors should be aligned and confirmed before entering the market. Even with these factors, proper risk management is essential in any trade to avoid excessive losses.